
Make your speed count.
Most companies have got faster. Fewer are further ahead. The ECI measures how much of your speed is actually getting you somewhere, and shows you where the rest leaks.
For chief executives and COOs running companies of 200 to 5,000 people. From Stillness Partners, authors of The Stillness Dividend.
Where does your speed go?
Every company moving fast is also, somewhere, losing some of that speed. Not to slowness. To friction that never shows up on a plan.
- How many decisions get made twice because the first one didn’t stick?
- How often does work reach delivery only to be sent back?
- How many senior people spend their week arbitrating disagreements that a clearer decision, made once, would have settled?
None of this means your company is broken. It means some of your speed is gross, not net.
You have already paid for the growth. It is still in the building.
What coherence is
Coherence is whether what a company decides is what it ends up doing. High coherence and a decision made once turns into delivered work. Low coherence and the same decision gets made twice, the work comes back, and nobody can point to where the time went.
It matters more now than it did. AI has changed how fast a company can act. Geopolitics has changed how little it can predict. Both put more weight on the same thing: whether the company moves as one.
The Execution Coherence Index measures it.
Who the ECI is for
The ECI is built for people running companies big enough to pull in more than one direction at once. Roughly 200 to 5,000 people. Often private equity backed or listed. Always under pressure to move faster than last year.
Chief executives. Chief operating officers. Chiefs of staff. The people leading a transformation. In short, the people who carry the result, and who have nobody above them to hand the problem to.
It is probably for you if any of this sounds familiar:
- You are being told to go faster with AI, and nobody has told you how fast is safe.
- Your teams are working flat out and you cannot point to what all that effort produced.
- You made a call in March. You are making it again in July.
- Your week fills up settling arguments between people who report to you.
- The numbers look fine. You would like to know what they will say in six months.
Buying a company, or holding one? The deal-side version is here.
Where it does not fit:
- Companies looking to do less. The ECI exists to help you do more of what you have already started.
- Companies looking for a culture or engagement survey. This measures how decisions travel and what happens to them.
- Companies small enough that one person can still see the whole thing.
You do not have to tell anyone which of those landed. The Challenge is ten questions, and the answers stay with you.
What we measure
Four dimensions. Every company loses some speed. The ECI measures how much, and where.

How we measure it
Twelve signals, three under each dimension. Each has a defined read, a unit and a named source, and most of them come from what your company already produces in the course of running itself: decision records, approval trails, plan against actual, portfolio and delivery data.
Where a number has to be estimated rather than pulled from a system, it is graded, and the grade travels with the number. You will always know which parts of your score are hard and which are judged.
A worked example
Scroll to see the full readout →
The path

The ECI’s foundations
Anyone can put a number on a company. What matters is what sits under it.
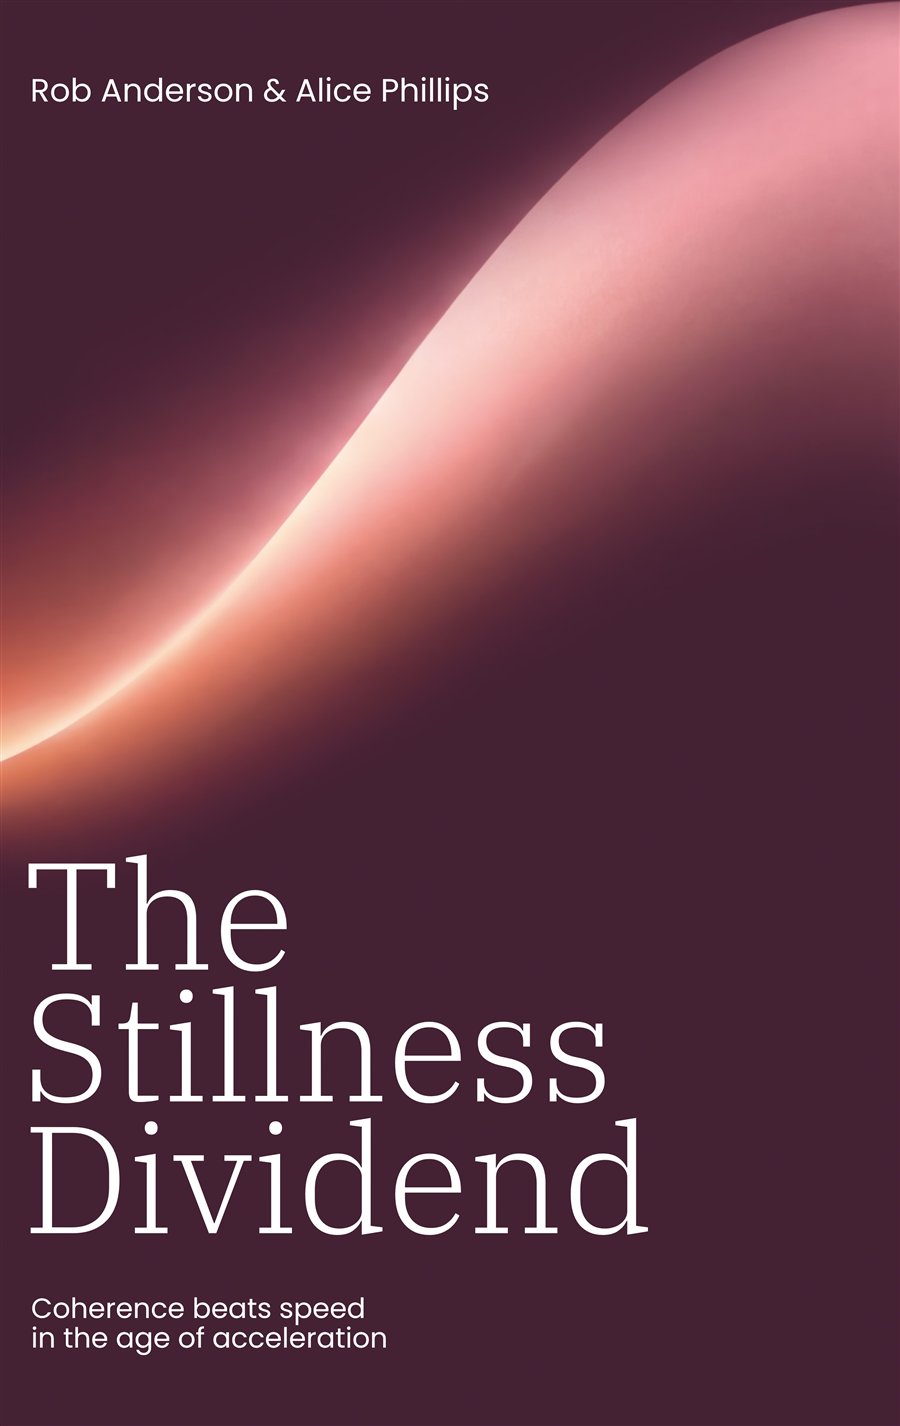
The argument. The ECI comes out of The Stillness Dividend (2026), by Rob Anderson and Alice Phillips. The book makes a simple case: as a company gets faster, the limit stops being how much it can do and becomes how much of that it gets to keep. The four dimensions are that argument turned into something you can measure.
The wider case. The thinking is also set out in a working paper, Protecting Organisational Judgement Under AI Acceleration, published on SSRN and free to read. It sets the ECI against existing research on how decisions get made and how much change a company can take at once.
Where it came from. Two careers spent inside the problem.
First as operators. Years running large sales organisations, where the distance between what was agreed in the room and what turned up in the quarter was a monthly fact of life.
Then as advisers to senior teams in professional services, the built environment, finance, culture and the public sector. Different sizes, different pressures, different words for everything. The losses were the same ones every time. Decisions made twice. Work sent back. Directors settling arguments that should never have reached them. Too much running at once.
The ECI is those patterns written down in a form that can be counted, and then closed.
What we do not claim. The ECI is new. There is no benchmark database behind it, so we will not be telling you your score puts you in the top quarter of British industry. That number does not honestly exist yet. What we can tell you is where your speed goes, how we know it, and how sure we are of each part.
The instrument is new. What it measures is not.
Find out how much of your speed you keep.
Ten questions your board should be able to answer. Five minutes. The answers stay with you.